





Recently, there has been no shortage of popular blog posts about how Postgres scales or why you should use it for everything. In this post, we'll do something a little different: describe an issue we had with a Postgres feature that intuitively should scale, but actually doesn't.
SELECT DISTINCT is an innocuous-seeming clause that finds all unique values of a column. However, its performance characteristics aren't what you'd expect: no matter how you index your table, no matter how few unique values there are to retrieve, SELECT DISTINCT will always scan every row that matches its predicates. We recently observed this when diagnosing the performance of a Postgres-backed queues workload, where SELECT DISTINCT turned out to be the most expensive query despite appearing to be the simplest and cheapest. In this blog post, we’ll explain what happened, what design decisions in Postgres make SELECT DISTINCT slow, and how to work around it.
Finding Unique Partitions with SELECT DISTINCT
We observed the slowdown in a Postgres-backed partitioned queues workload. Each queue is divided into partitions (for example, one per user) so flow control can be applied independently to each partition (for example, allowing each user to run at most one task at a time). The first step in dequeueing workflows from a partitioned queue is to find all “active” partitions, meaning partitions with an ENQUEUED workflow on them. We originally used `SELECT DISTINCT` to do this:
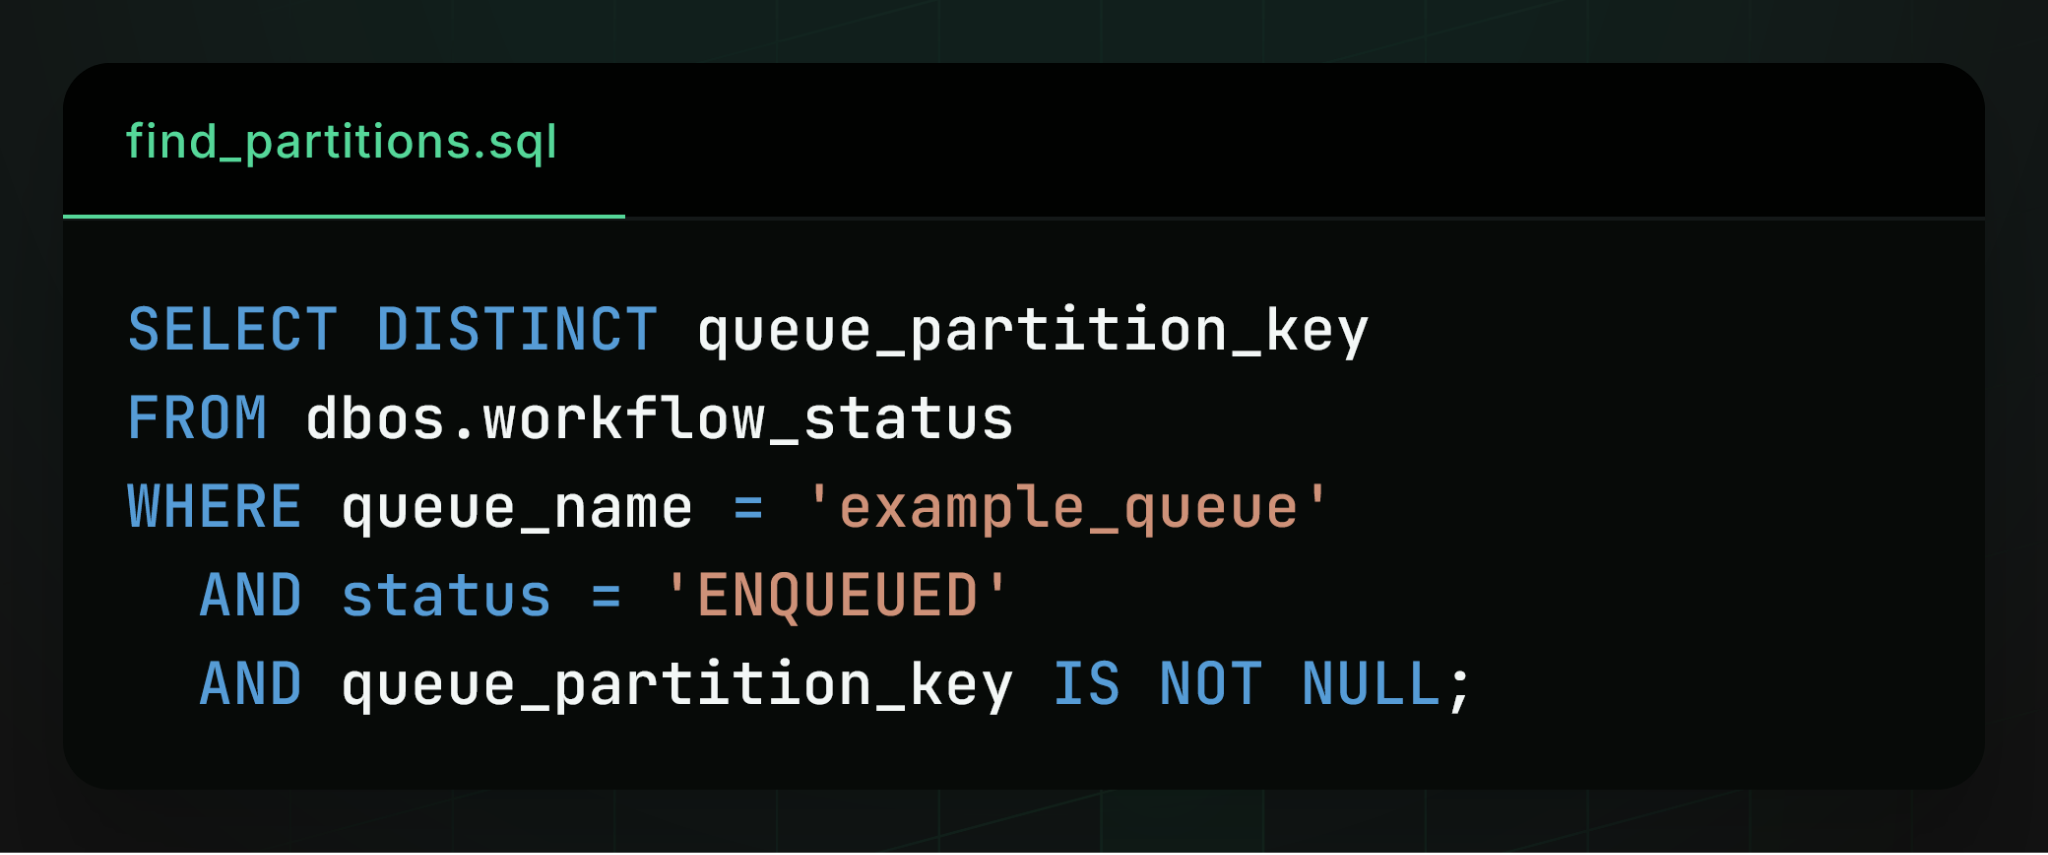
What SELECT DISTINCT does is find all unique values of a column given some condition. So this query finds all unique non-NULL partition keys among ENQUEUED workflows on a particular queue. We expected this query to be fast because it’s properly indexed using an index on queue name, workflow status, and partition key:
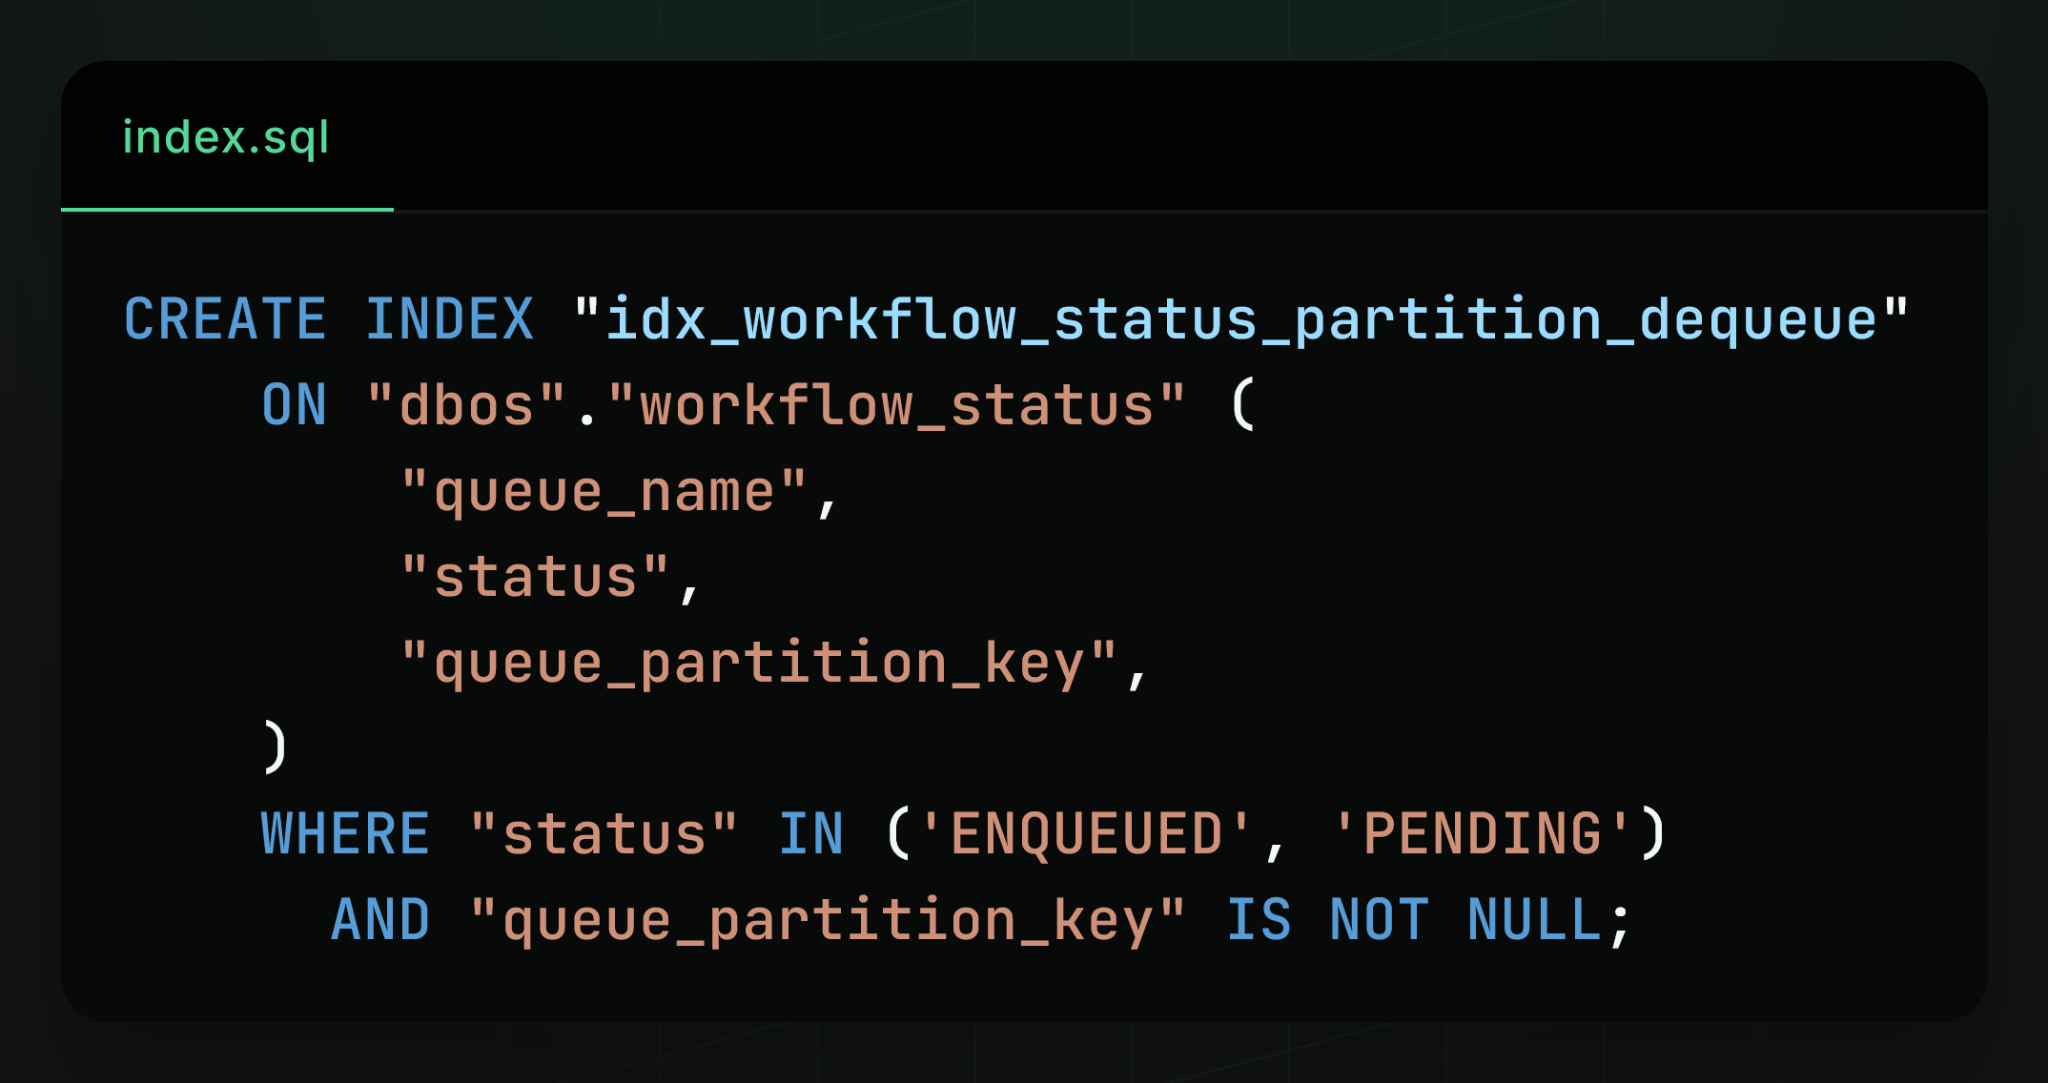
Intuitively, the index looks like this. Workflows are laid out in a tree structure first by queue name, then by status, then by partition key. This allows Postgres to efficiently locate workflows using all three fields.
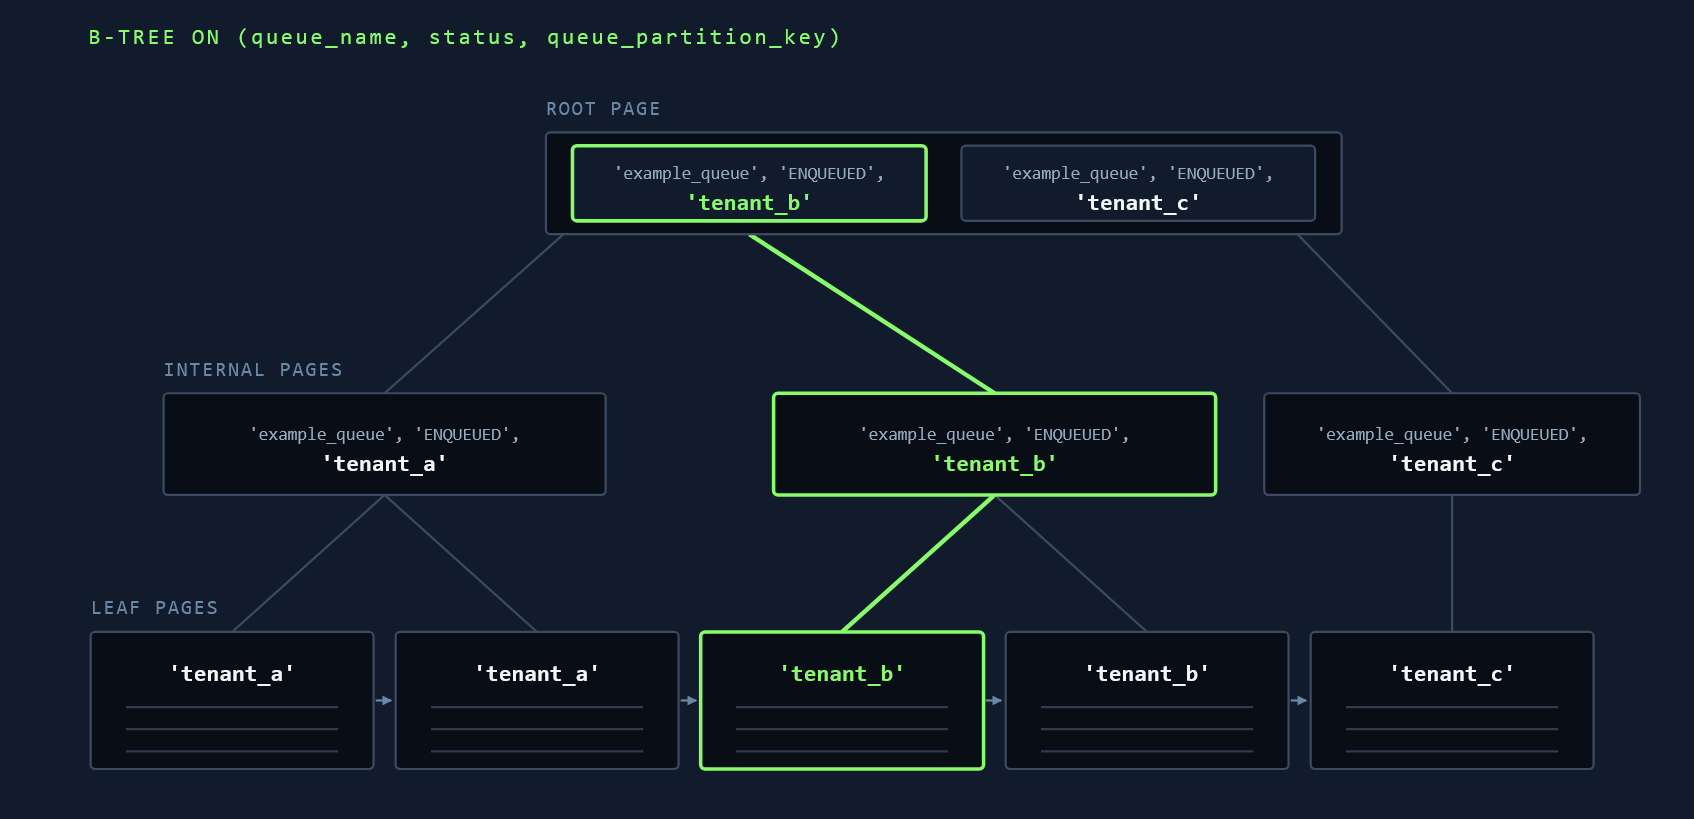
Because the index has this shape, we expected the performance of this query to be O(number of active partitions). After all, to satisfy this query Postgres only needs to seek a single row from each unique partition, then return the partition keys it found.
Initially, this appeared to be working as intended. Most of our queue workloads were “wide but shallow” with many partitions but few enqueued workflows per partition. For those, the query performed as expected. However, we soon encountered issues with “narrow but deep” workloads where there were few partitions, but they each contained many enqueued workflows. We expected the query to finish in under a millisecond because there were so few partitions, but instead it took seconds. We quickly realized this meant the query was scaling not with the number of active partitions, but with the total number of enqueued workflows, making it unacceptably slow.
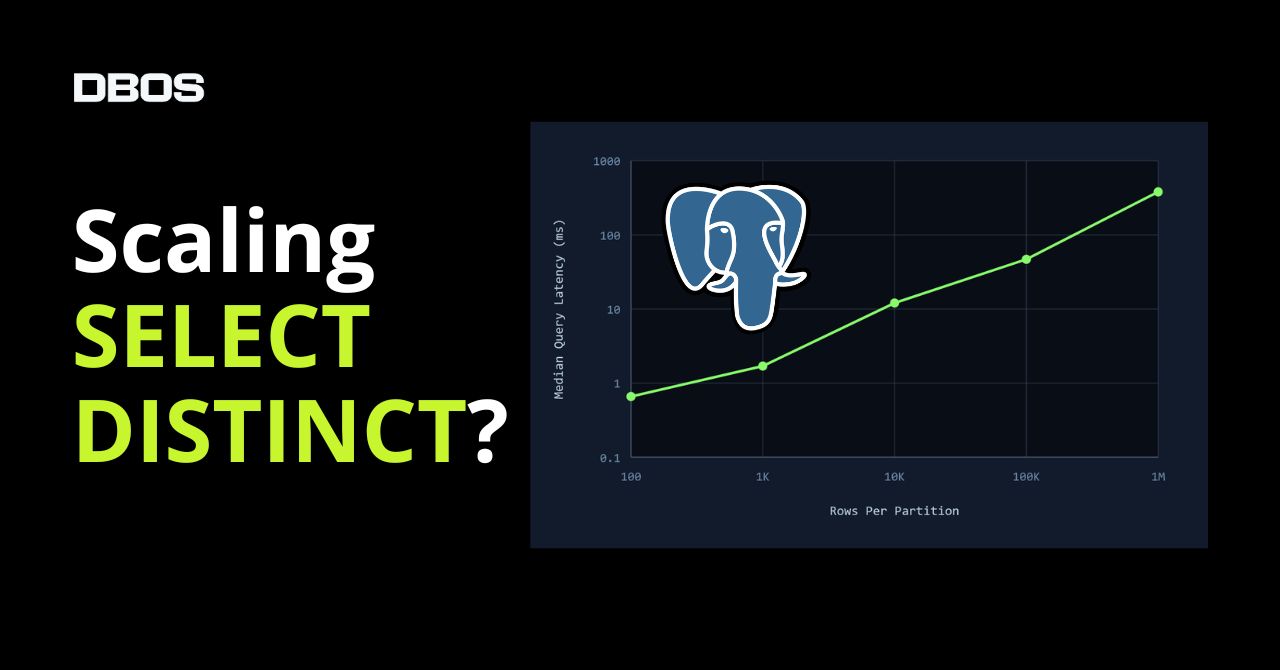
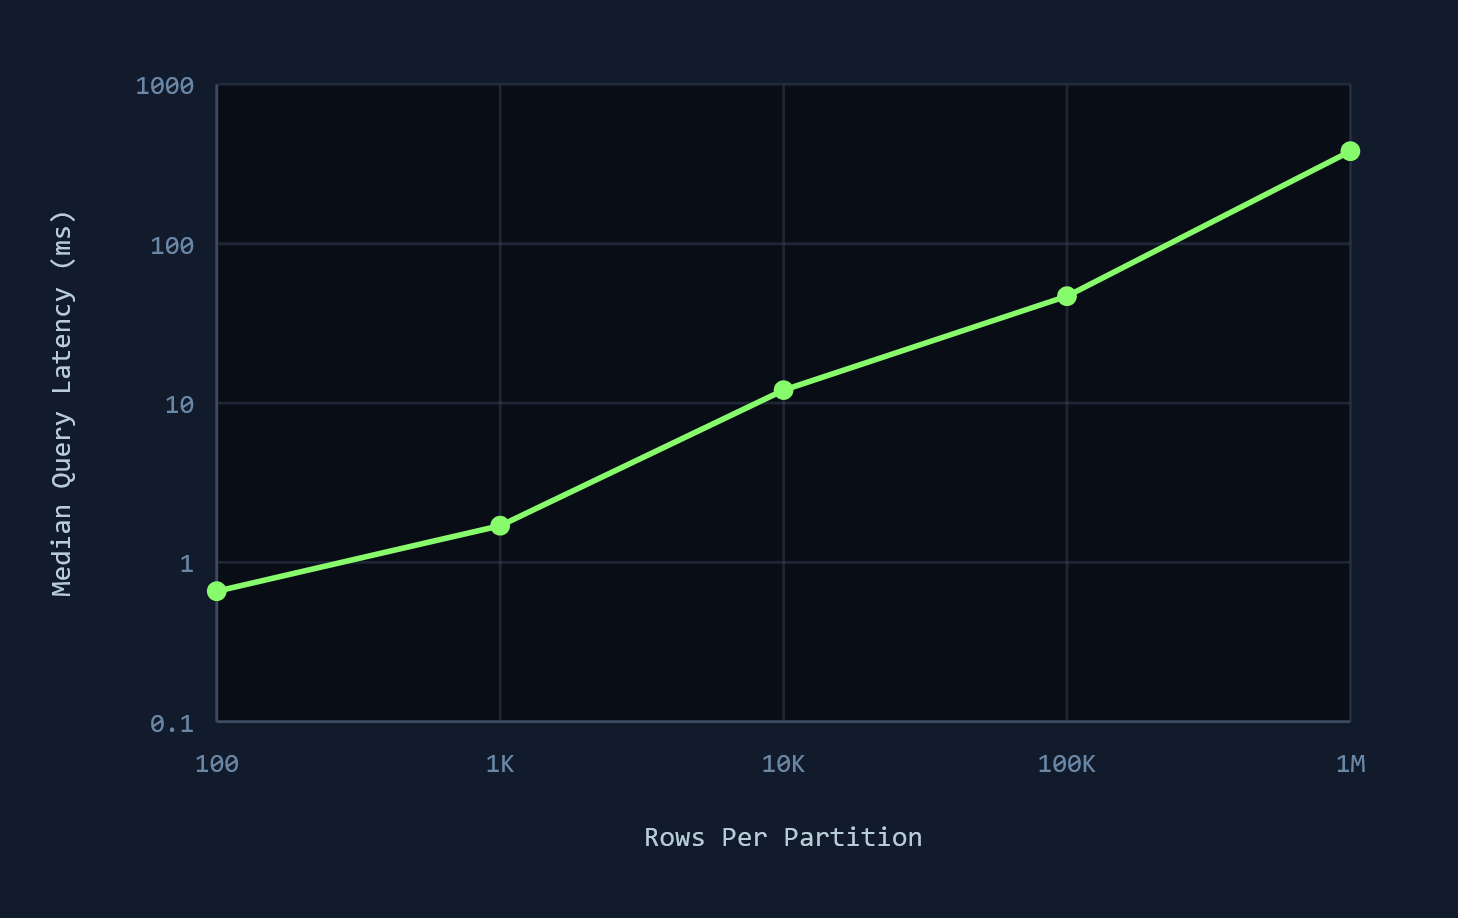
We validated this observation with a benchmark fixing the number of partitions at 10 but scaling the number of rows per partition from 100 to 1M. As we can see, query latency scales linearly with the number of rows per partition.
To understand why that was happening and how to fix it, we’ll have to examine how Postgres plans and executes this query.
The SELECT DISTINCT Query Plan
When we examined the query plan Postgres was using for the SELECT DISTINCT query, it looked like this (assuming 1M enqueued workflows across 3 partitions):
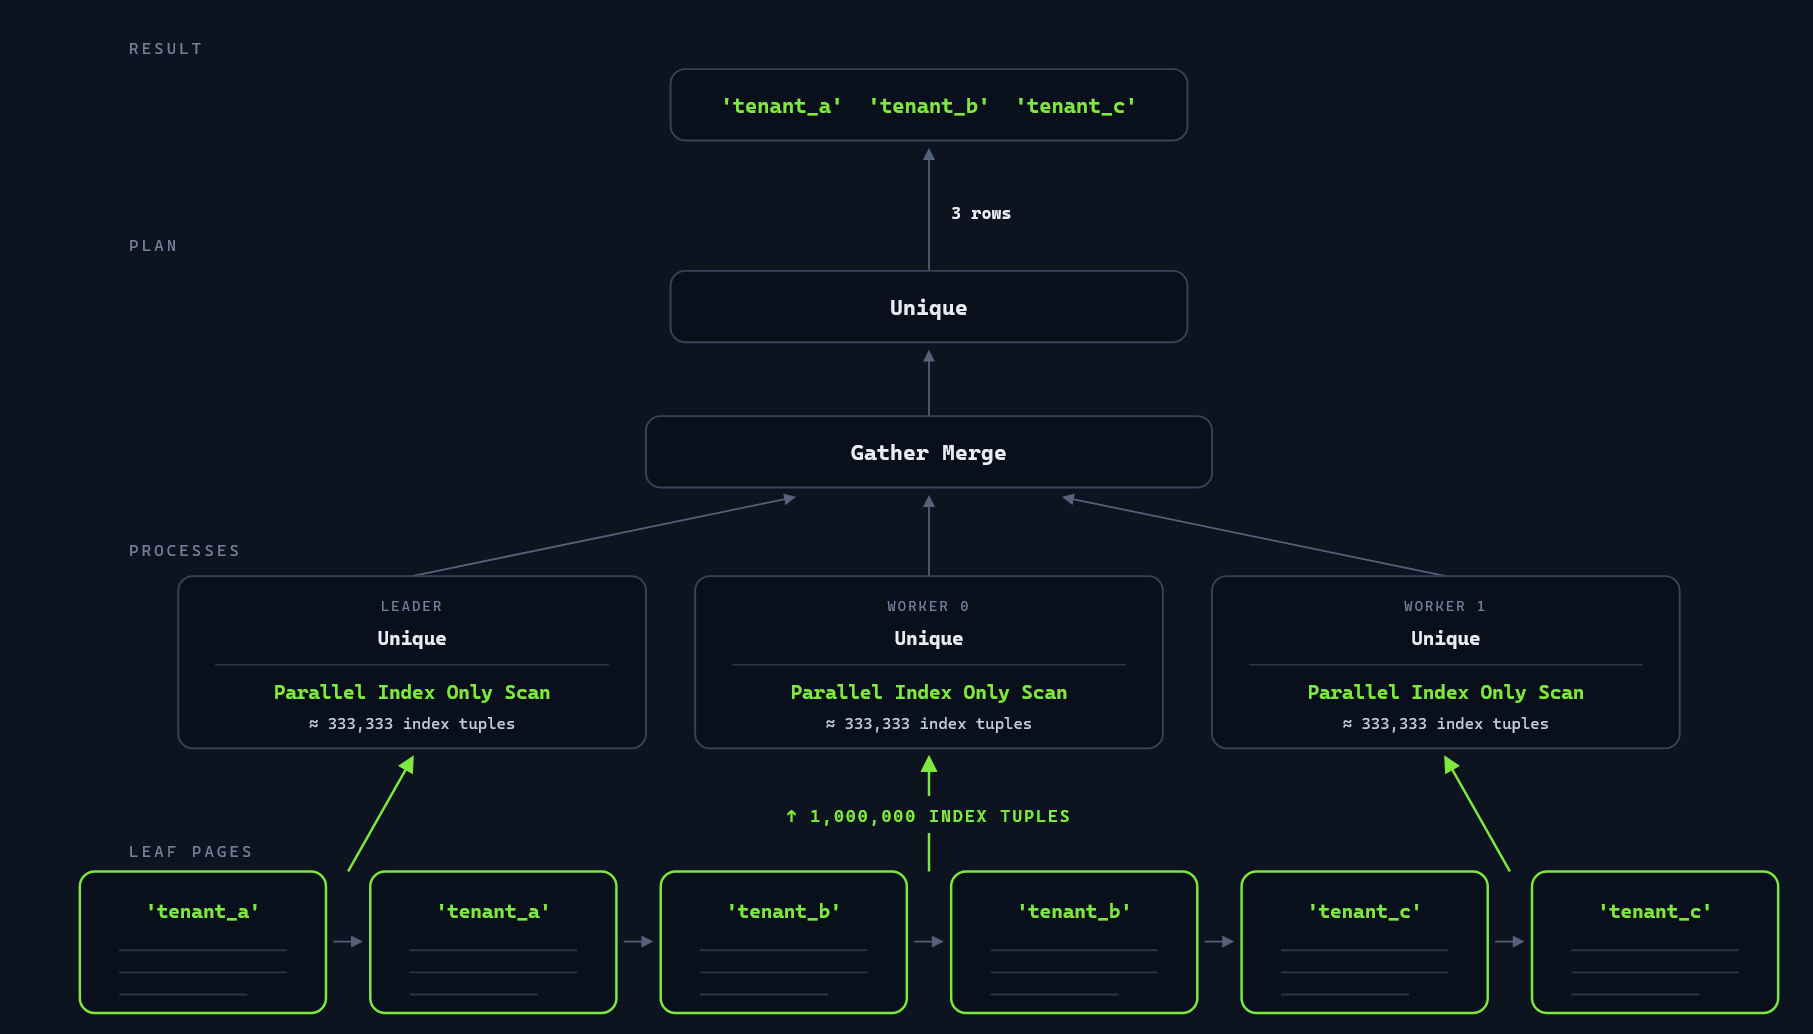
Essentially, Postgres is doing a full index scan: walking the index to retrieve every single enqueued workflow on a particular queue (in this case, 1M rows total) and checking if it contains a unique partition key. This explains the performance we saw: the reason run time scales with the total number of enqueued workflows is because Postgres is actually scanning every single enqueued workflow. This is supremely wasteful: in this example Postgres scanned 1M rows to find just three partition keys it could have directly retrieved from the index.
The Postgres query planner chooses this plan because it doesn’t have an alternative. Every operator implemented in Postgres for scanning an index performs a full index scan, retrieving all indexed values matching its predicates. Other relational databases do better: MySQL provides a “loose index scan” operator that retrieves only each unique value that satisfies its predicates.
Interestingly, Postgres 18 added something like a loose scan: a skip scan optimization that “skips” rows when searching a multicolumn index on a column other than its leftmost column. However, in our case, this still scans all rows that match its predicates, so it can’t be used to speed up SELECT DISTINCT. Separately, there was a significant attempt to add a loose index scan in 2018, but it was abandoned after four years of effort and maintainer churn.
Mitigating the Slowdown
Because the performance of SELECT DISTINCT scales with the size of the table and not the number of unique values it contains, it is not usable at scale. To efficiently count the number of unique values in a table, we instead need a workaround: a more elaborate query that effectively coerces Postgres into generating an efficient query plan.
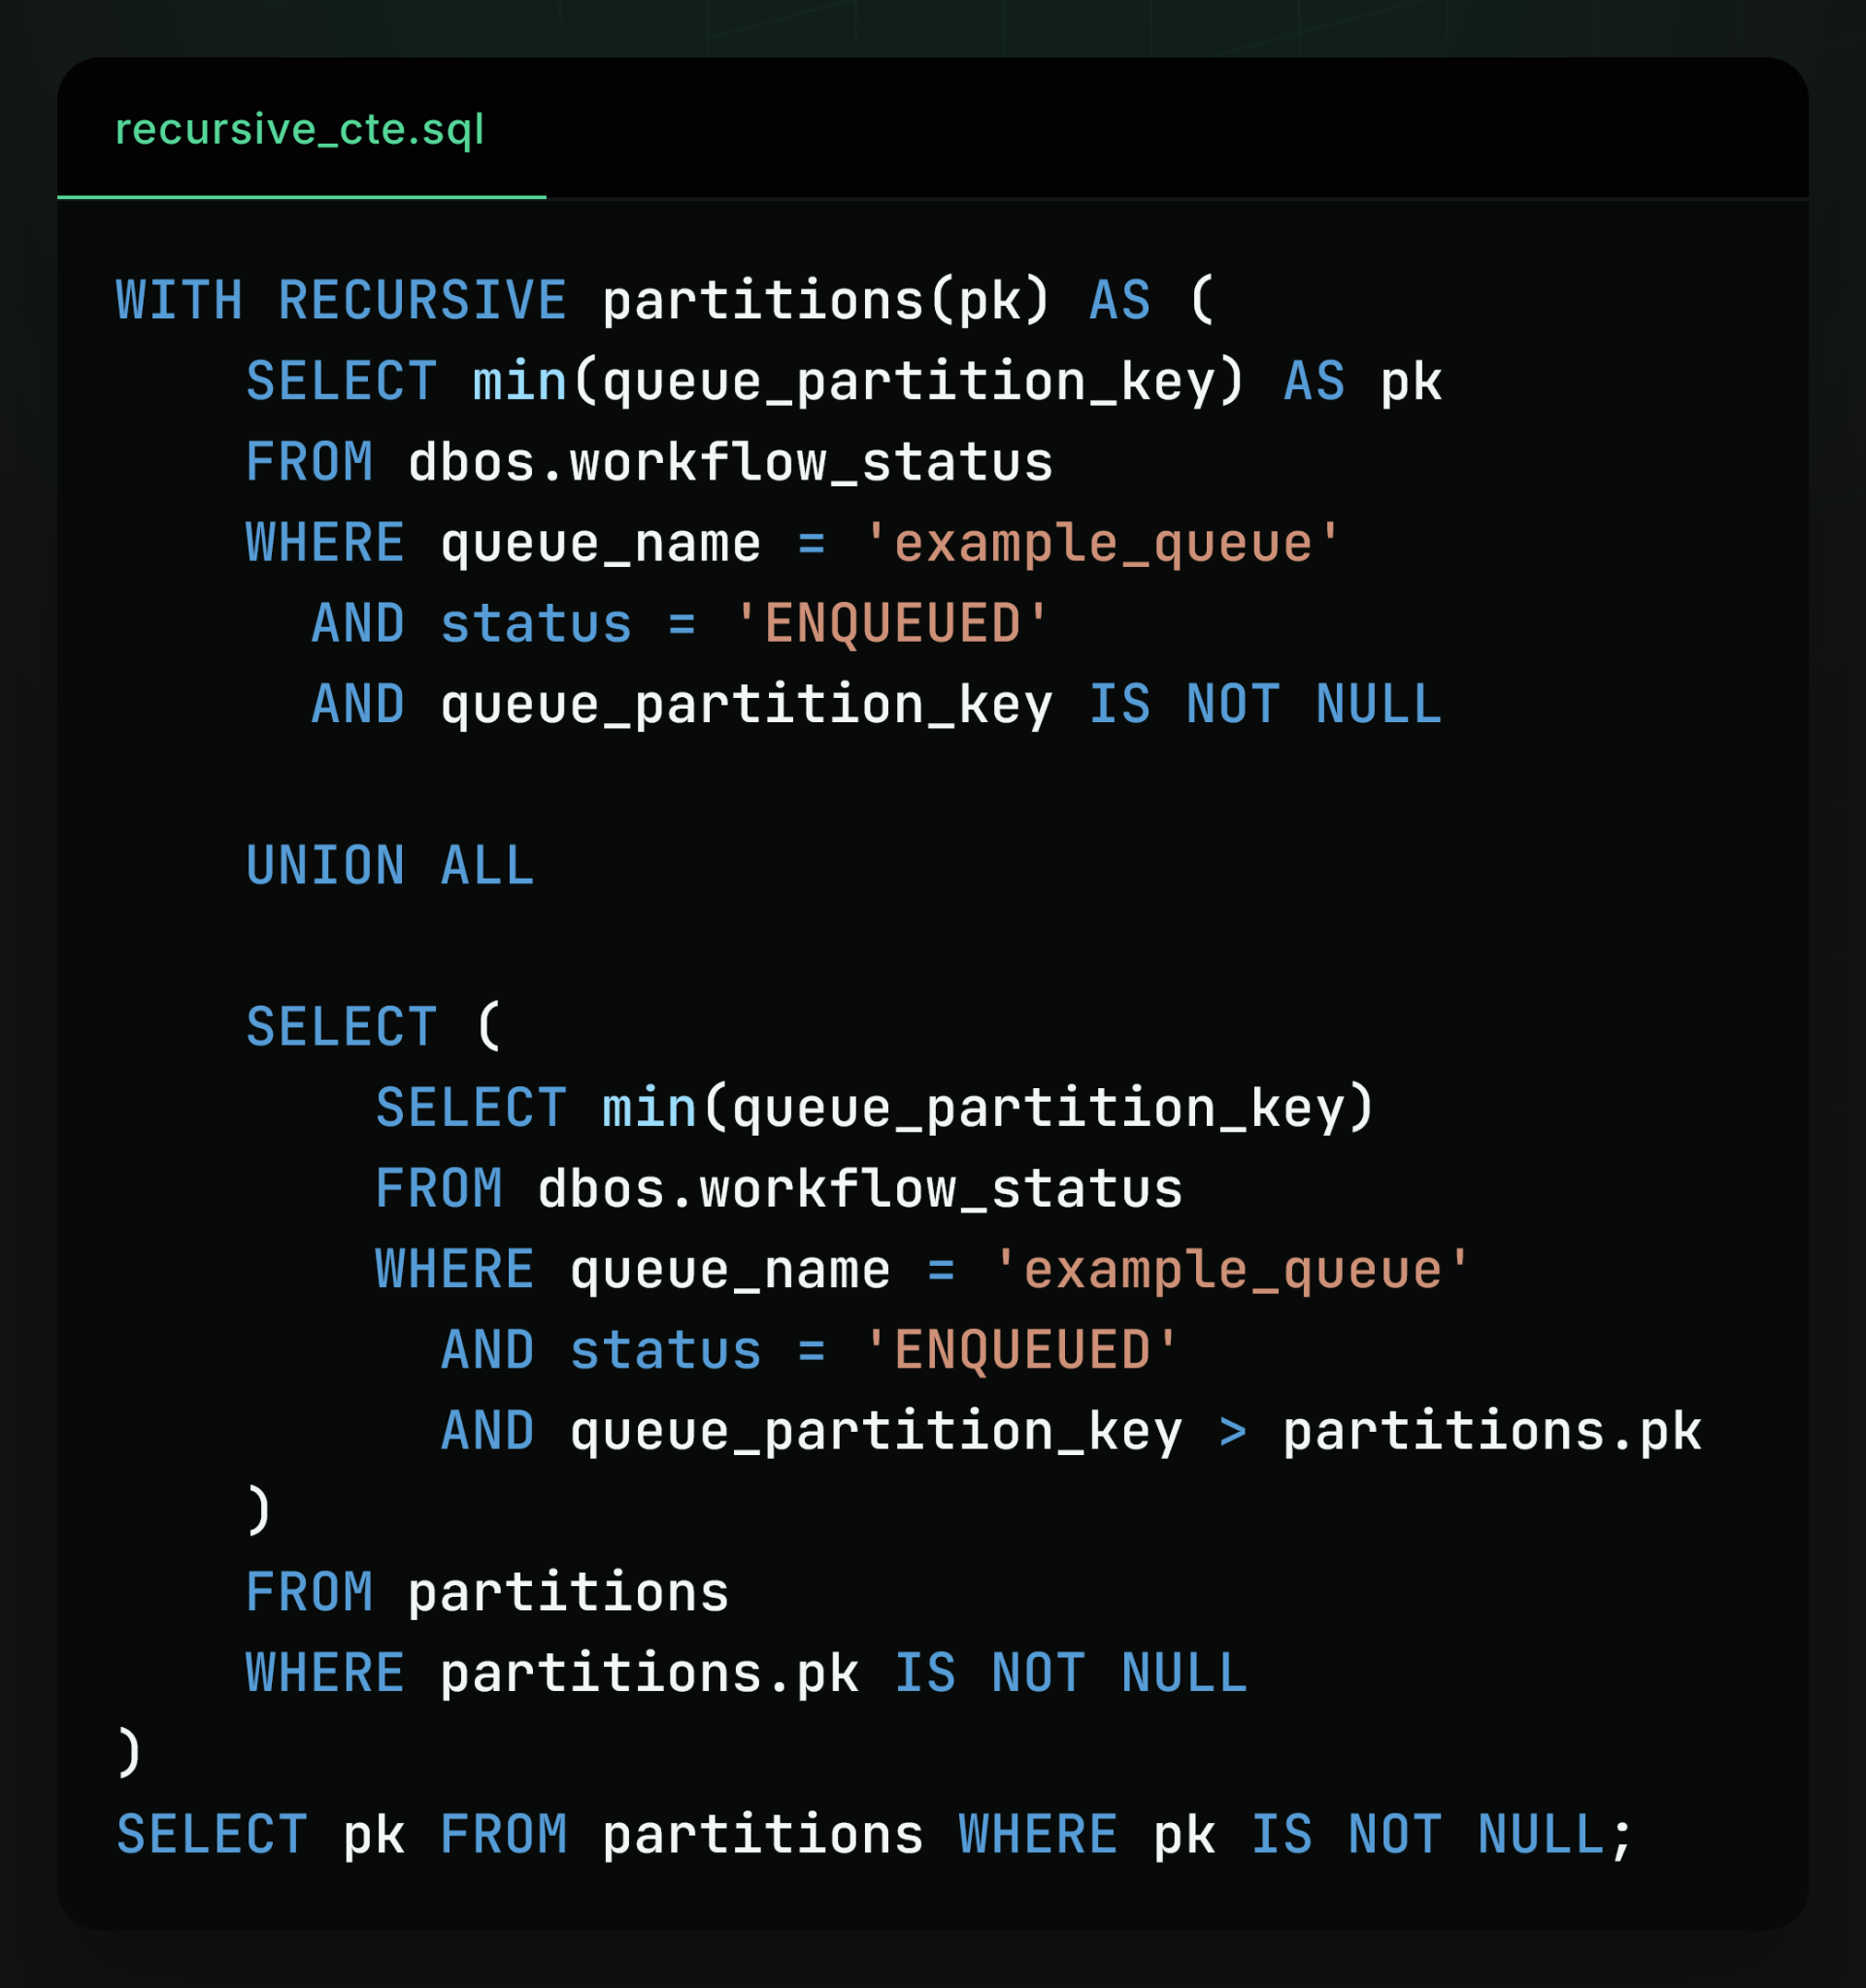
This query is remarkably hard to read because it utilizes a recursive common table expression (CTE). To first approximation, this is a way to write imperative code in otherwise-declarative SQL. Essentially, this query evaluates as a loop whose first iteration finds the “smallest” partition key and whose subsequent iterations each find the “next” unique partition key after it. Here’s what that looks like:
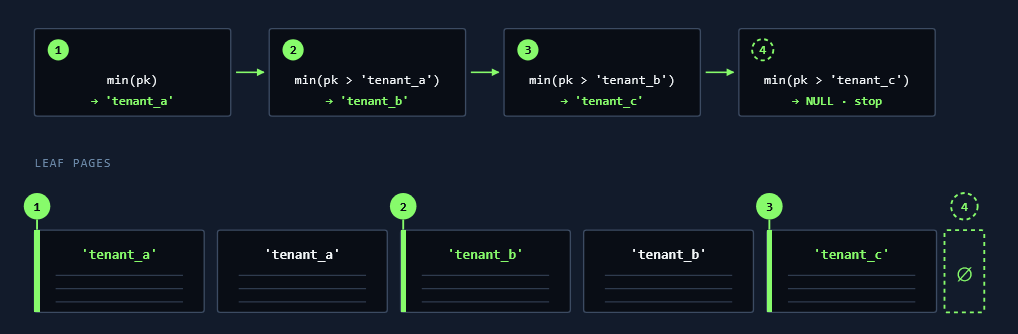
Each loop iteration does a SELECT min() on a sorted index, so it only retrieves a single value instead of scanning the entire index. Therefore, because each loop iteration does fixed work and the total number of loop iterations is equal to the number of unique partitions, this query provides the O(number of partitions) performance we need.
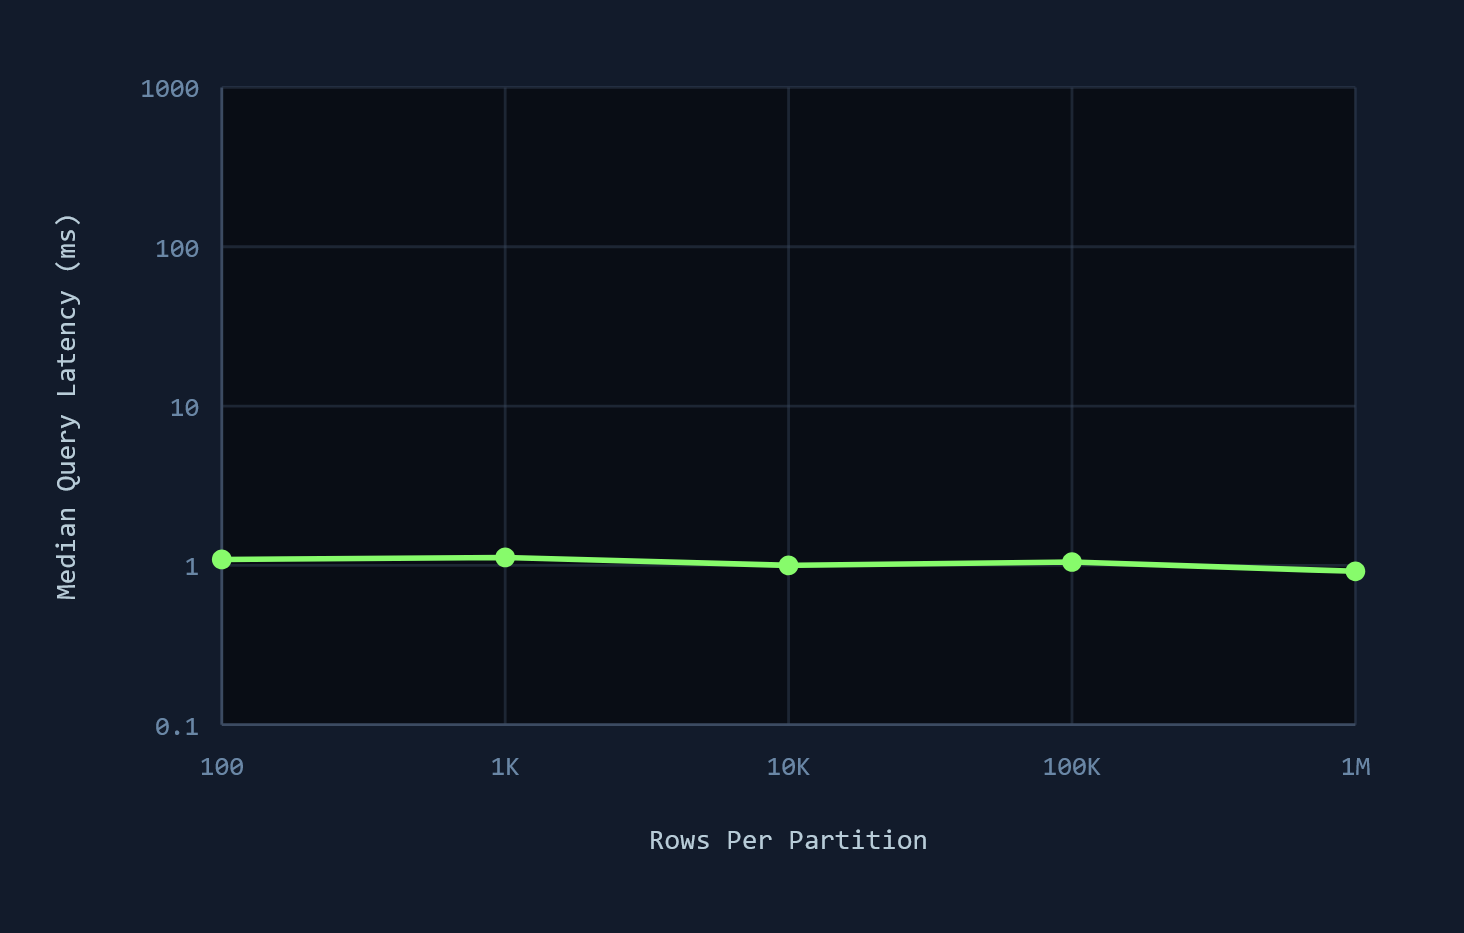
To validate this performance, we benchmark the new query, fixing the number of partitions at 10 but varying the number of rows per partition from 1K to 1M. As we can see, median latency does not change no matter how large the partitions get:
Learn More
If you like building scalable, reliable systems, we’d love to hear from you. At DBOS, our goal is to make Postgres-backed durable execution as simple and performant as possible. Check it out:
- Quickstart: https://docs.dbos.dev/quickstart
- GitHub: https://github.com/dbos-inc
- Discord community: https://discord.gg/eMUHrvbu67