


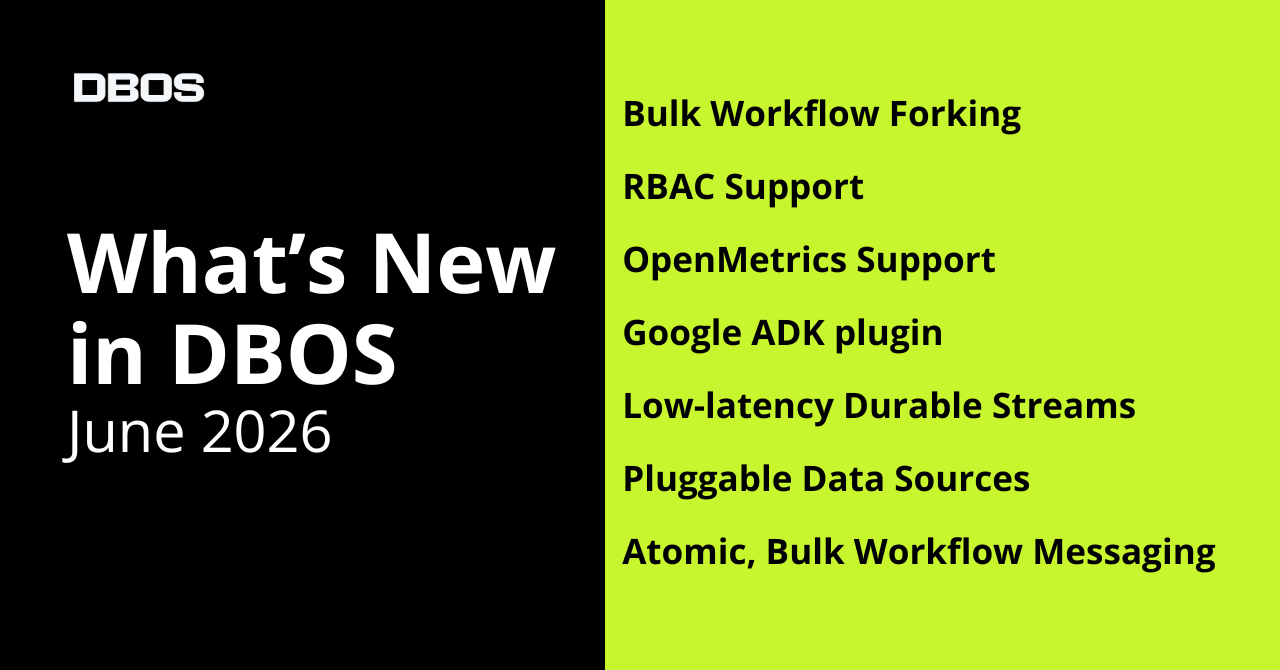

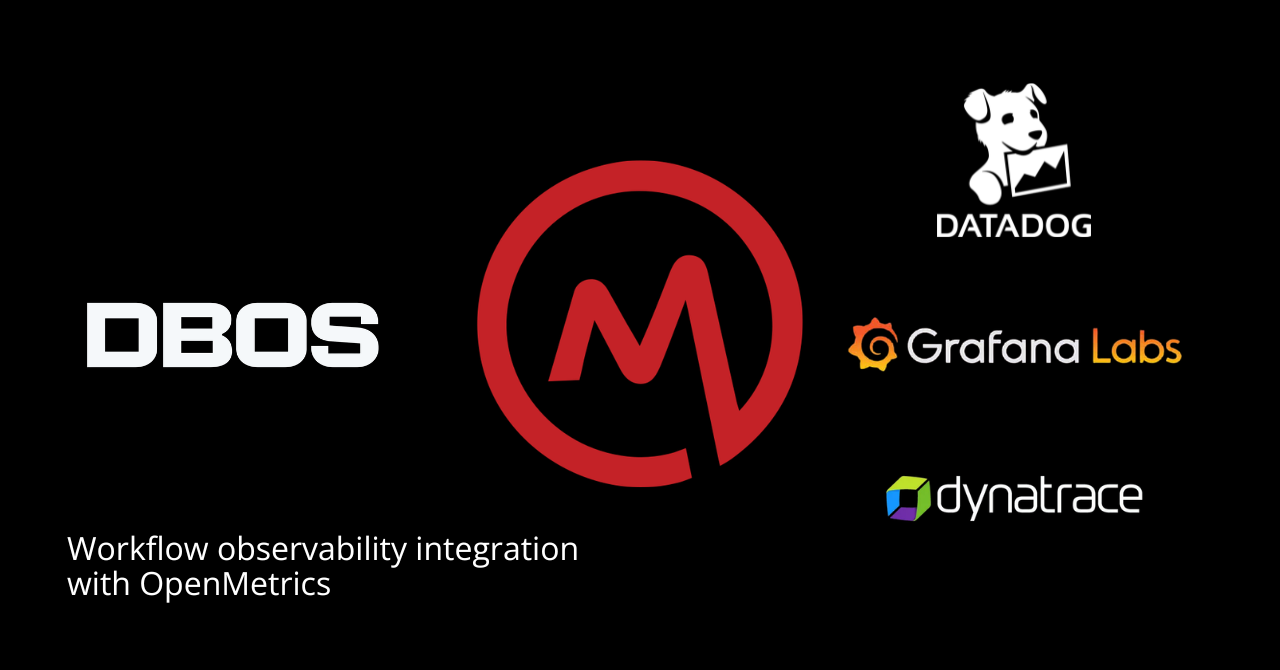
One of the most common requests we hear from users is how to integrate durable workflows into their observability stack. To make that easier, we’re releasing metrics for your DBOS applications. Using DBOS Conductor, you can now scrape metrics about your applications’ workflows, steps, and executors from a Prometheus/OpenMetrics-compatible endpoint. This lets you monitor your durable workflows in Datadog, Prometheus, Grafana, or any tool that understands the OpenMetrics format.
How DBOS Support for OpenMetrics Support Works
All metrics are exposed from a single Prometheus/OpenMetrics-compatible scrape endpoint:
https://cloud.dbos.dev/v1/metricsScraping metrics only requires an authenticated GET with a Conductor API key as a bearer token. This means you can ingest metrics from any Prometheus/OpenMetrics-compatible system, including Datadog, Prometheus, and the OpenTelemetry Collector. Once metrics are scraped into your system, you can create your own dashboards and visualizations just like for any other observability data. For example, you can scrape metrics data with Prometheus then visualize it in Grafana:
What You Can Monitor via OpenMetrics
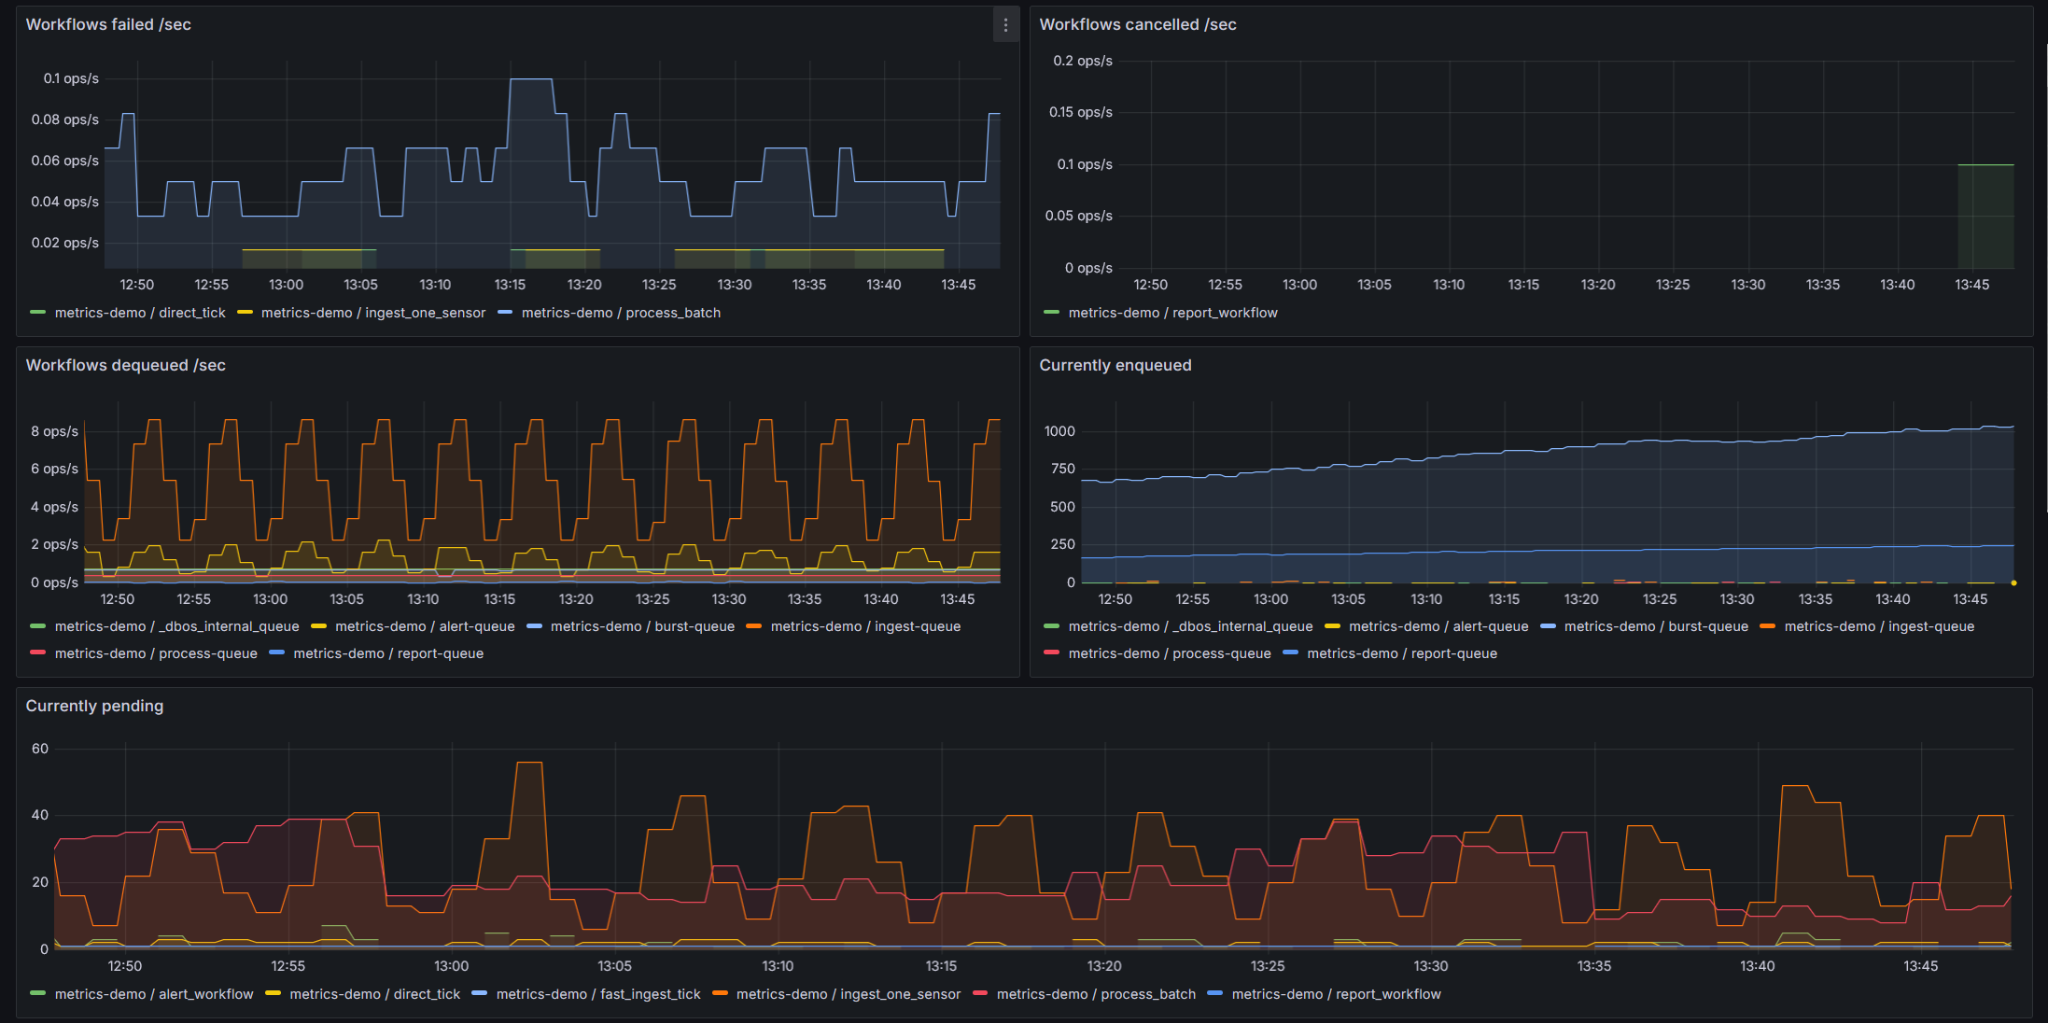
OpenMetrics support in DBOS lets you monitor the health and activity of your workflows, steps, and executors. All metrics are labeled by application as well as by workflow, step, and/or queue name (as appropriate), so you can analyze and aggregate them as needed:
- Workflow throughput and outcomes: The number of workflows started, dequeued, succeeded, failed, and cancelled per second.
- Queue health: How many workflows are currently enqueued or executing, the ages of the oldest enqueued and oldest running workflows, and the maximum time workflows waited in a queue
- Latency: Maximum end-to-end workflow latency and maximum step duration over a time period
- Step throughput and outcomes: The number of steps that succeeded or failed per second
- Executor status: The number of executors registered per application, labeled by health status and application version.
OpenMetrics-Based Alerting
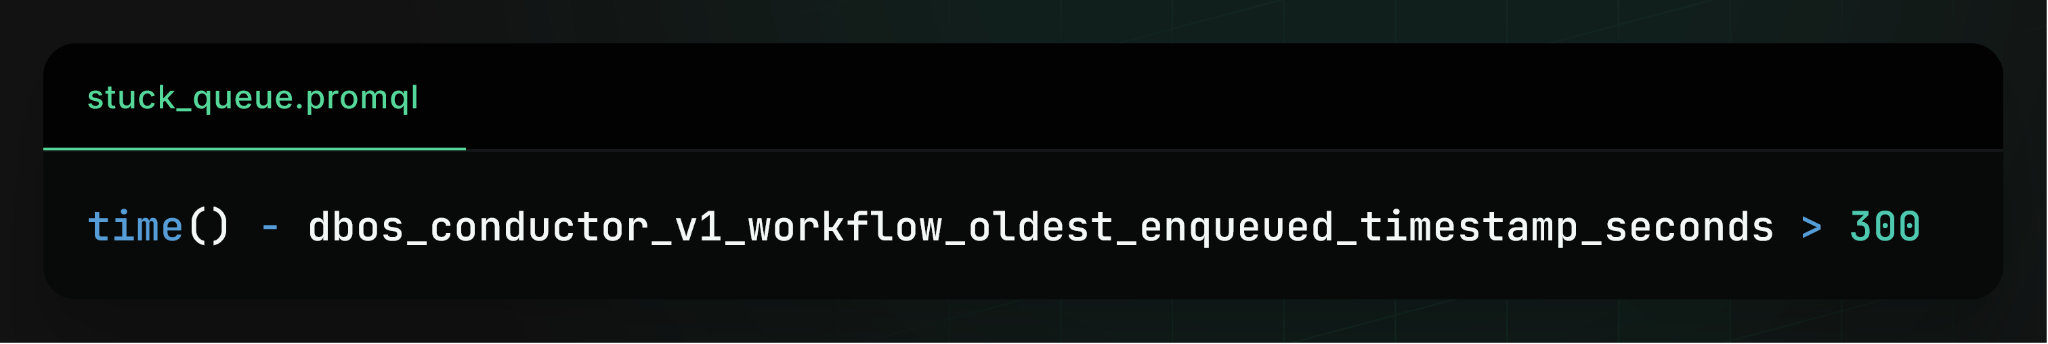
You can use metrics to define custom alerting rules for your durable workflows in your observability backend. Most observability systems, including Datadog and Grafana, support PromQL alerting rules over custom metrics. For example, you can fire an alert if a workflow has been waiting in a queue for more than five minutes:
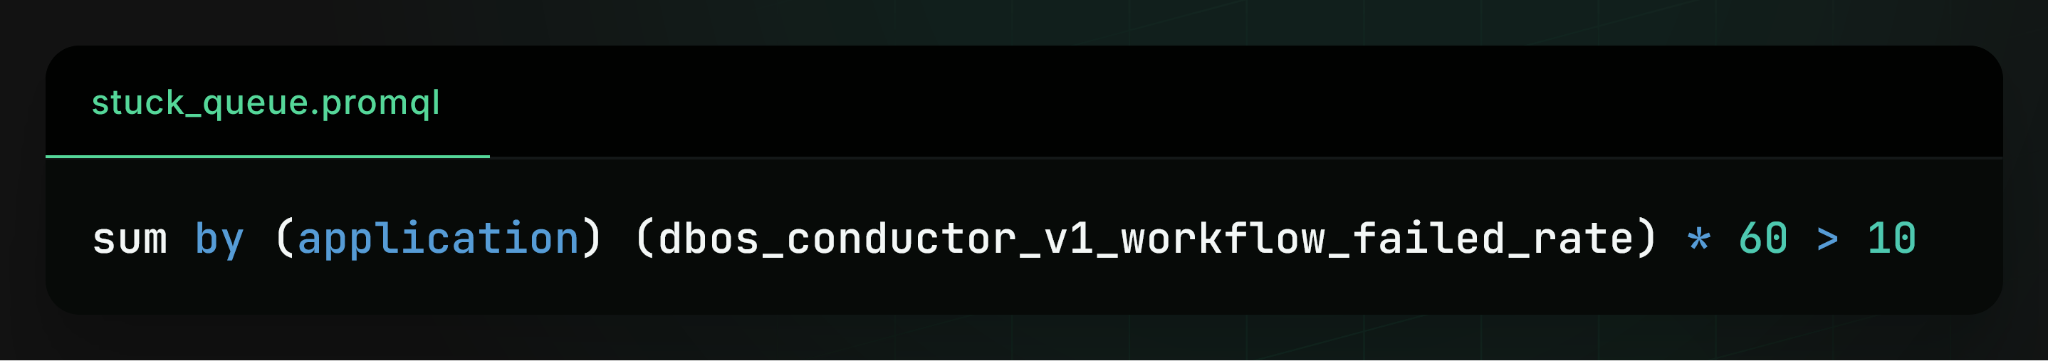
Or if more than 10 workflows fail in a minute:
Try It Out
Conductor metrics are available now on DBOS Teams plans and require DBOS Python >=2.23.0 or DBOS TypeScript >=4.19.0. To get started, generate an API key from the DBOS Console, point your Prometheus/OpenMetrics-compatible monitoring system at the endpoint, and you should start seeing durable workflow metrics.
Also check out the full documentation here: https://docs.dbos.dev/production/metrics